
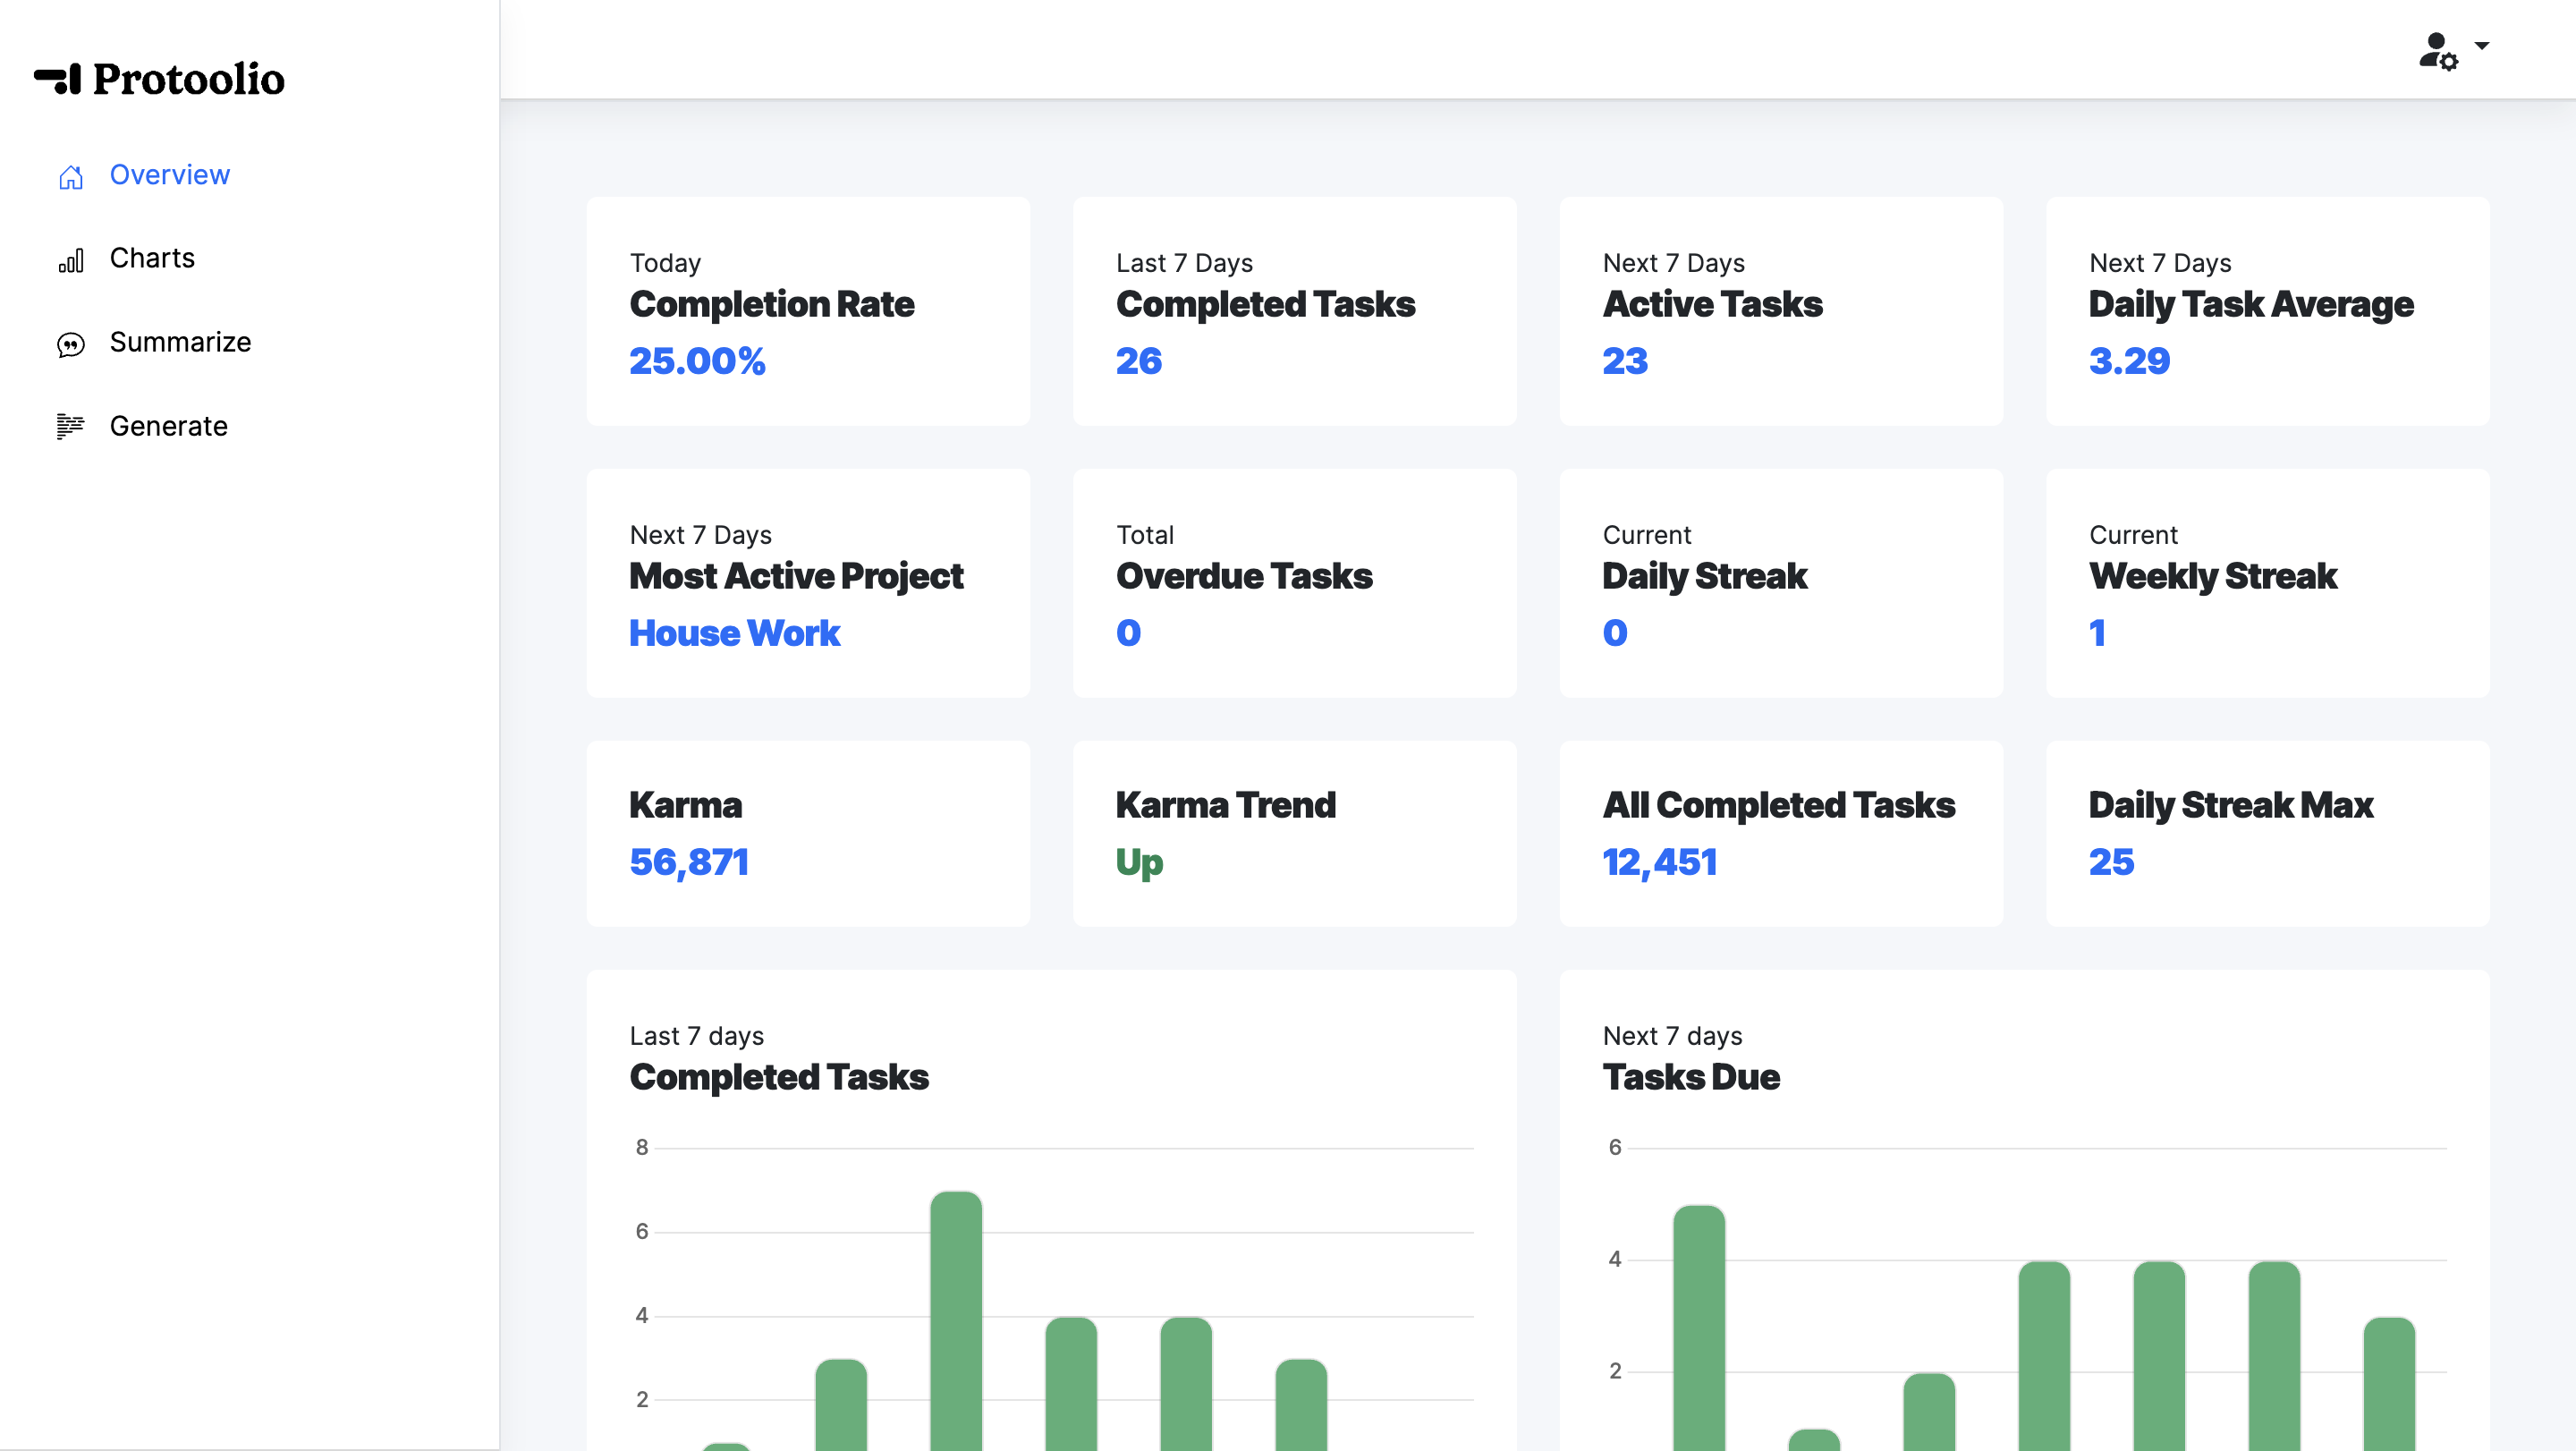
Your productivity at a glance
The dashboard gives you a snapshot of your Todoist task activity. See metrics like completed tasks, completion rate, daily task average, most active project, and more.
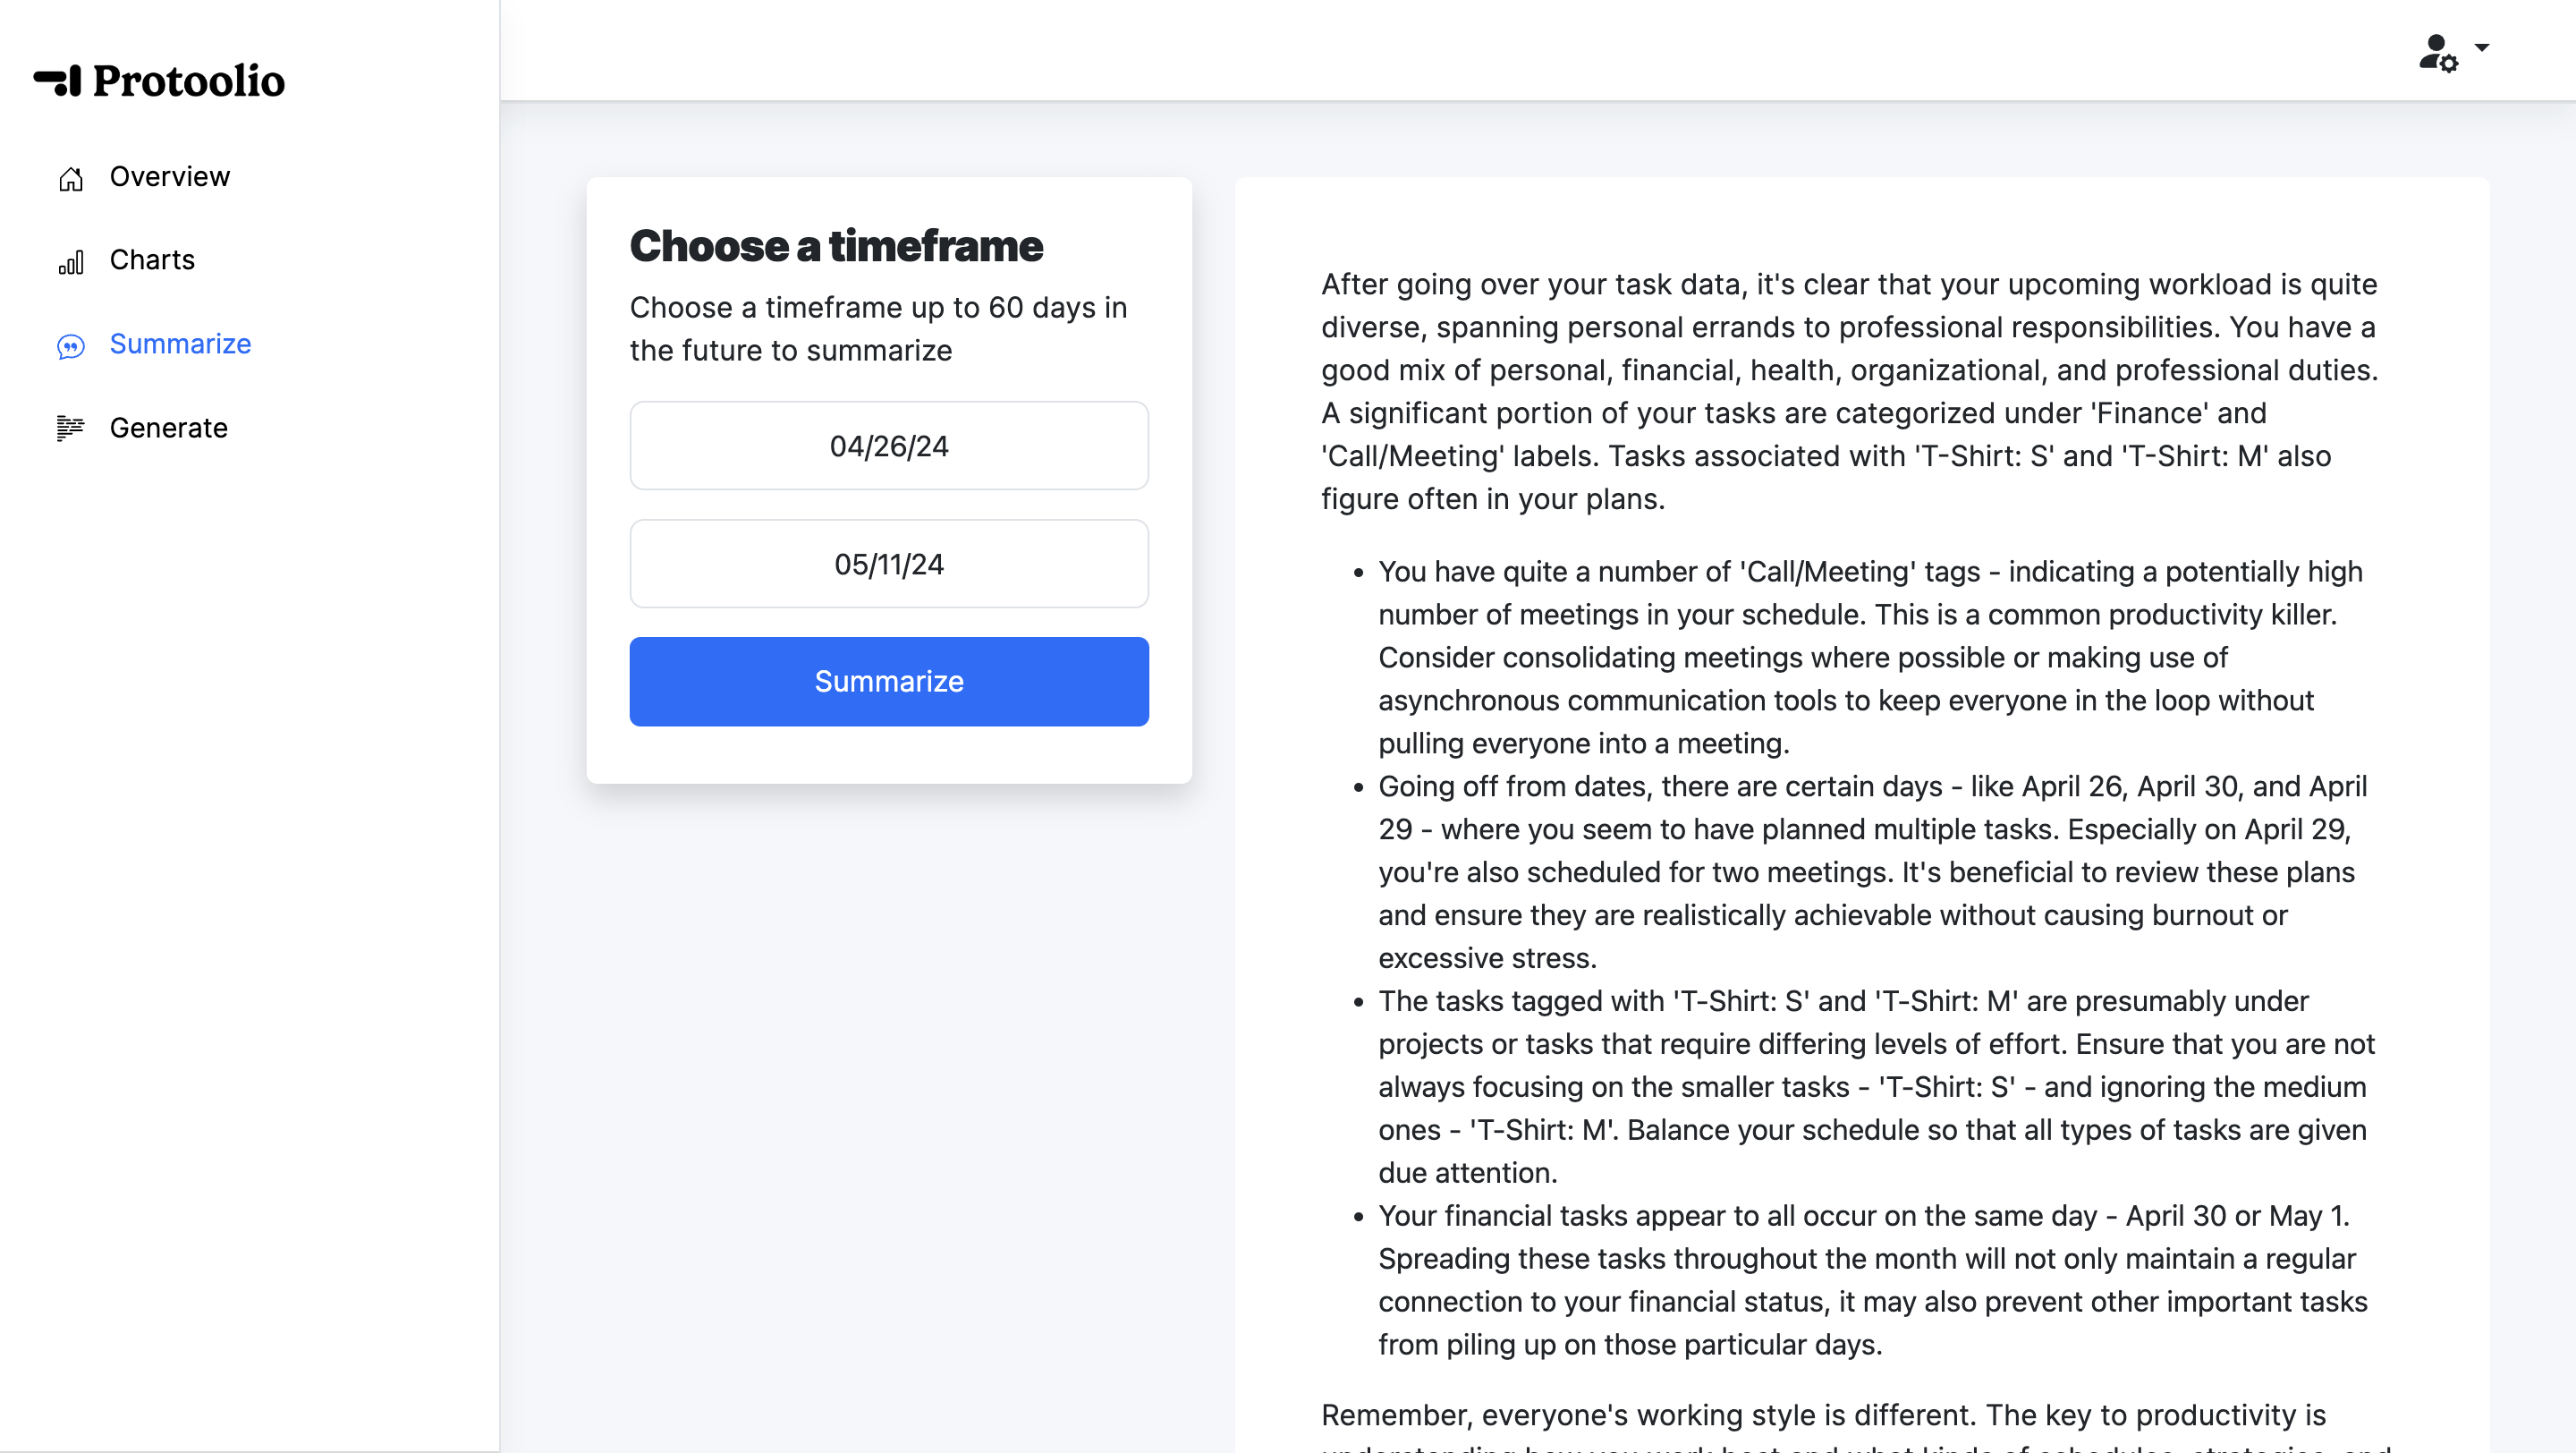
Summarize tasks with AI
Get a glimpse of what's ahead. Our AI tool is like your own executive assistant and can summarize your upcoming tasks for the next 60 days.
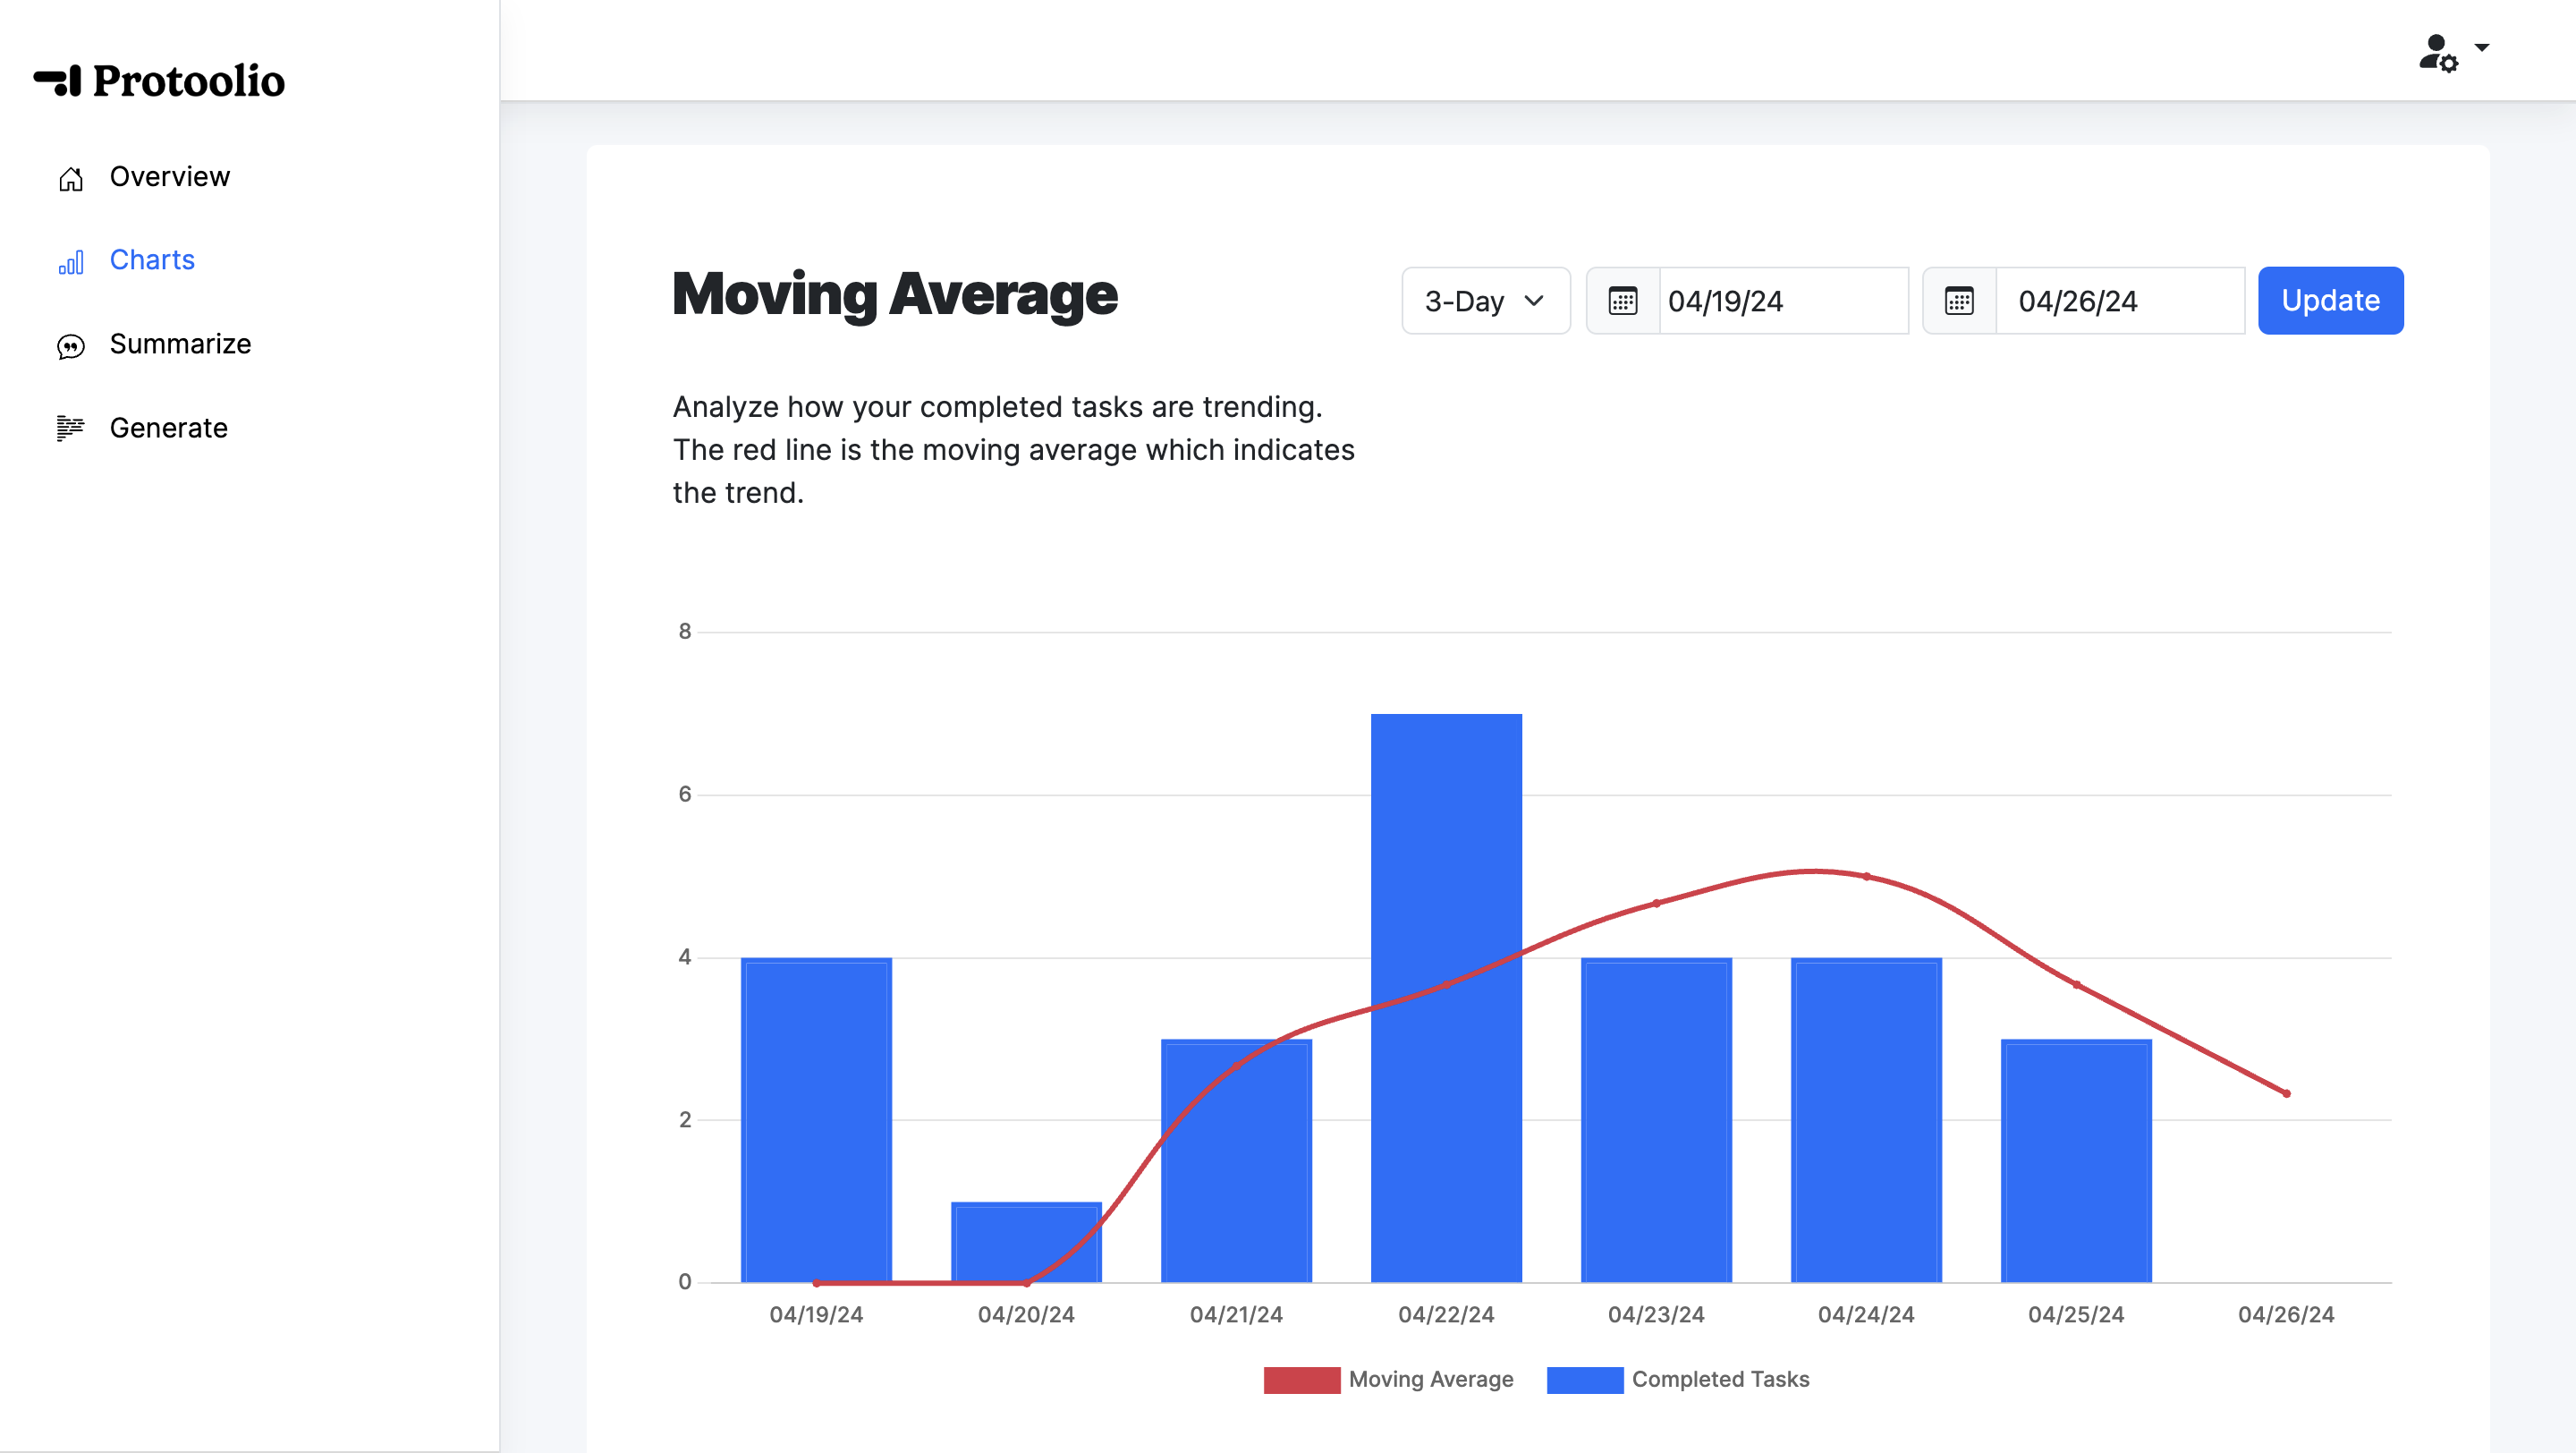
Insightful charts
See your task activity in the form of a heatmap, moving average bar chart, project breakdown bar chart, or a simple completed task bar chart.
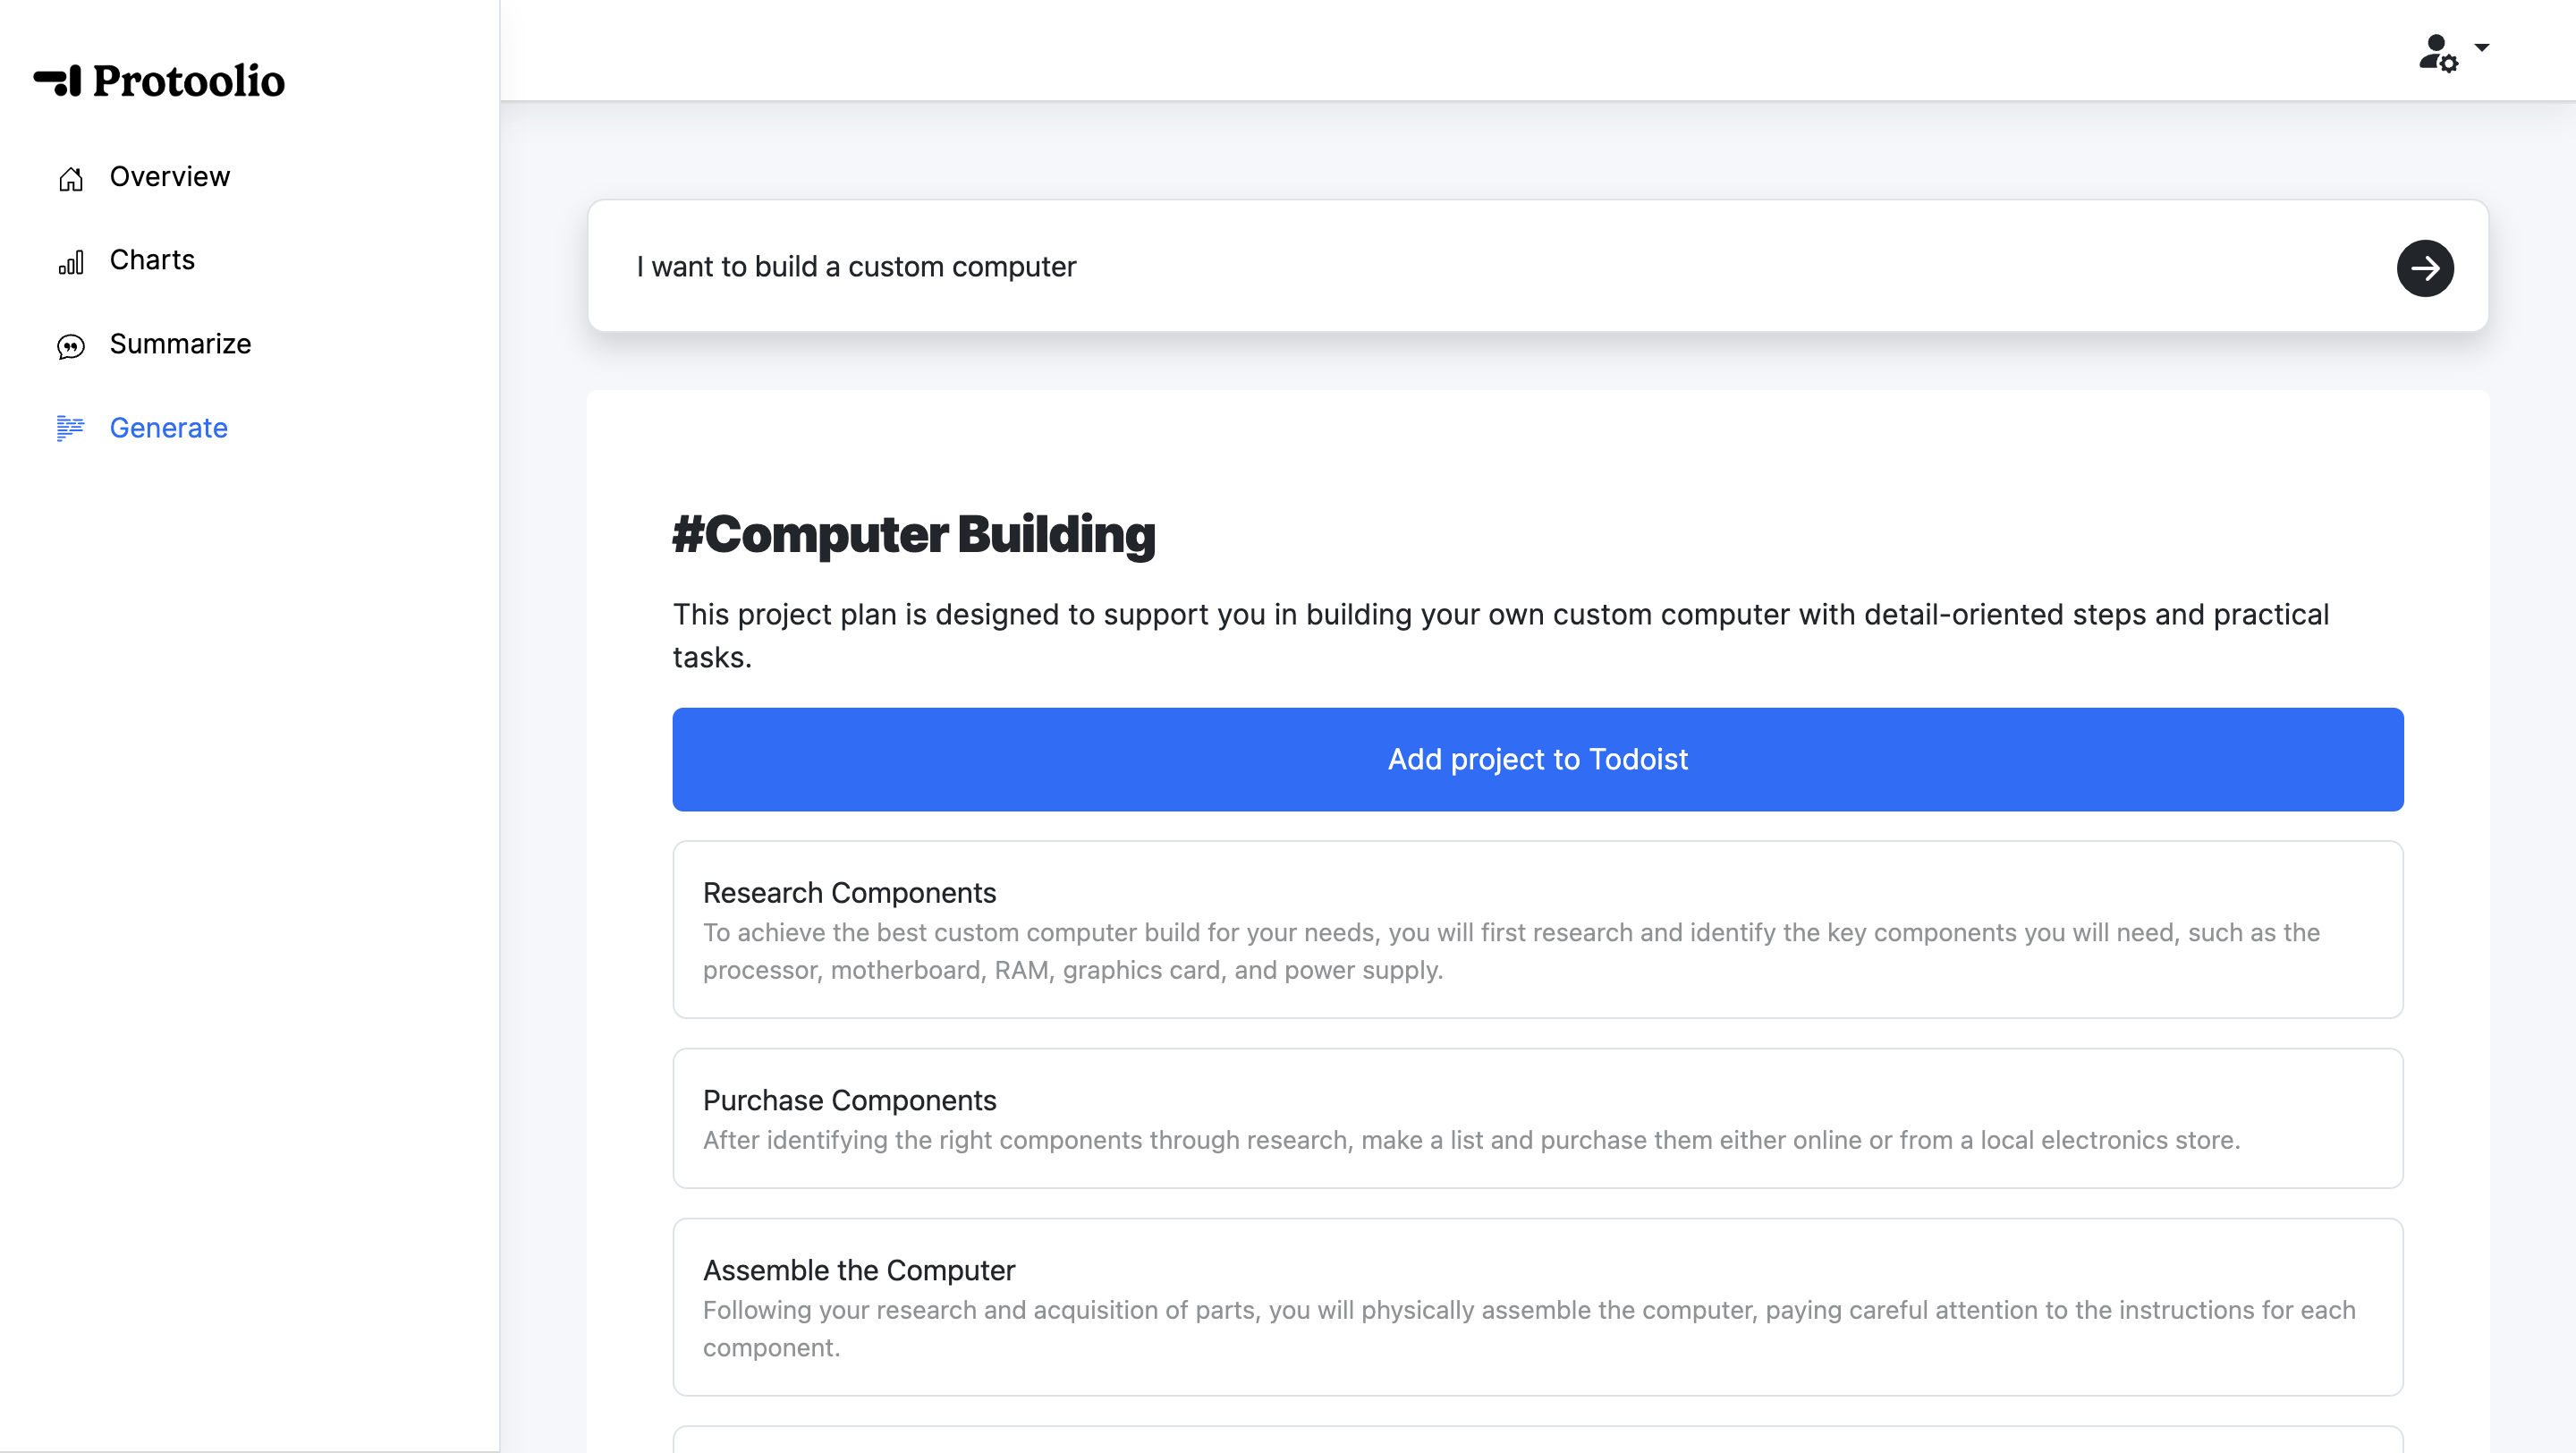
Generate tasks with AI
Need help creating tasks for a new project in Todoist? Our AI tool can create a task template for any goal, making task planning much faster.
Project Pages
Create a public, read-only analytics page for any Todoist project. Great for team and client collaboration.
Google Chrome
Get a comprehensive look at your Todoist task activity—right from your new tab page.
Frequently asked questions
If we decide to permanently store your Todoist data in the future, we will ask for your permission to do so.
How to use Analytics for Todoist
Review Todoist task activity through summary metrics, charts, project views, and optional AI features. The integration helps you spot patterns in the task data available from your account.
How to use this tool
Connect your Todoist account, choose the view or project you want to examine, and compare the same time windows. Use summaries as a planning aid and review any generated task suggestions before applying them.
Example
Compare your completion activity across recent weeks and inspect the project breakdown to see where recorded work is concentrated.
Understanding your result
Task counts measure recorded completions, not effort, quality, or hours worked. API availability, subtasks, timezones, and caching can produce differences from Todoist’s own displays. Public project pages should contain only information you intend to share.
Related tools: Fast Task Creator for Todoist · RICE Framework Template.